User Demographics Dashboard
The User Demographics Dashboard shows a summary of user demographic profiles and activity for the selected environment.
To access the User Demographics Dashboard, in the PingOne admin console, go to Monitoring > User Demographics.
Filters
You can limit the data to:
-
Today
-
From Yesterday
-
Last 7 Days (Default)
-
Last 30 Days
-
Last 90 Days
-
This Month
-
Last Month
-
Custom Range
|
Data older than 180 days is not available for filtering. You can only select dates within a 6 month window. The charts are always shown in UTC time, regardless of the selection. |
Charts
Use the following controls to adjust the charts:
| Icon | Name | Description |
|---|---|---|
|
Maximize |
Expands the chart to fill the dashboard. To minimize the chart, click the icon again. |
|
Menu options |
Options can vary for different types of charts:
|


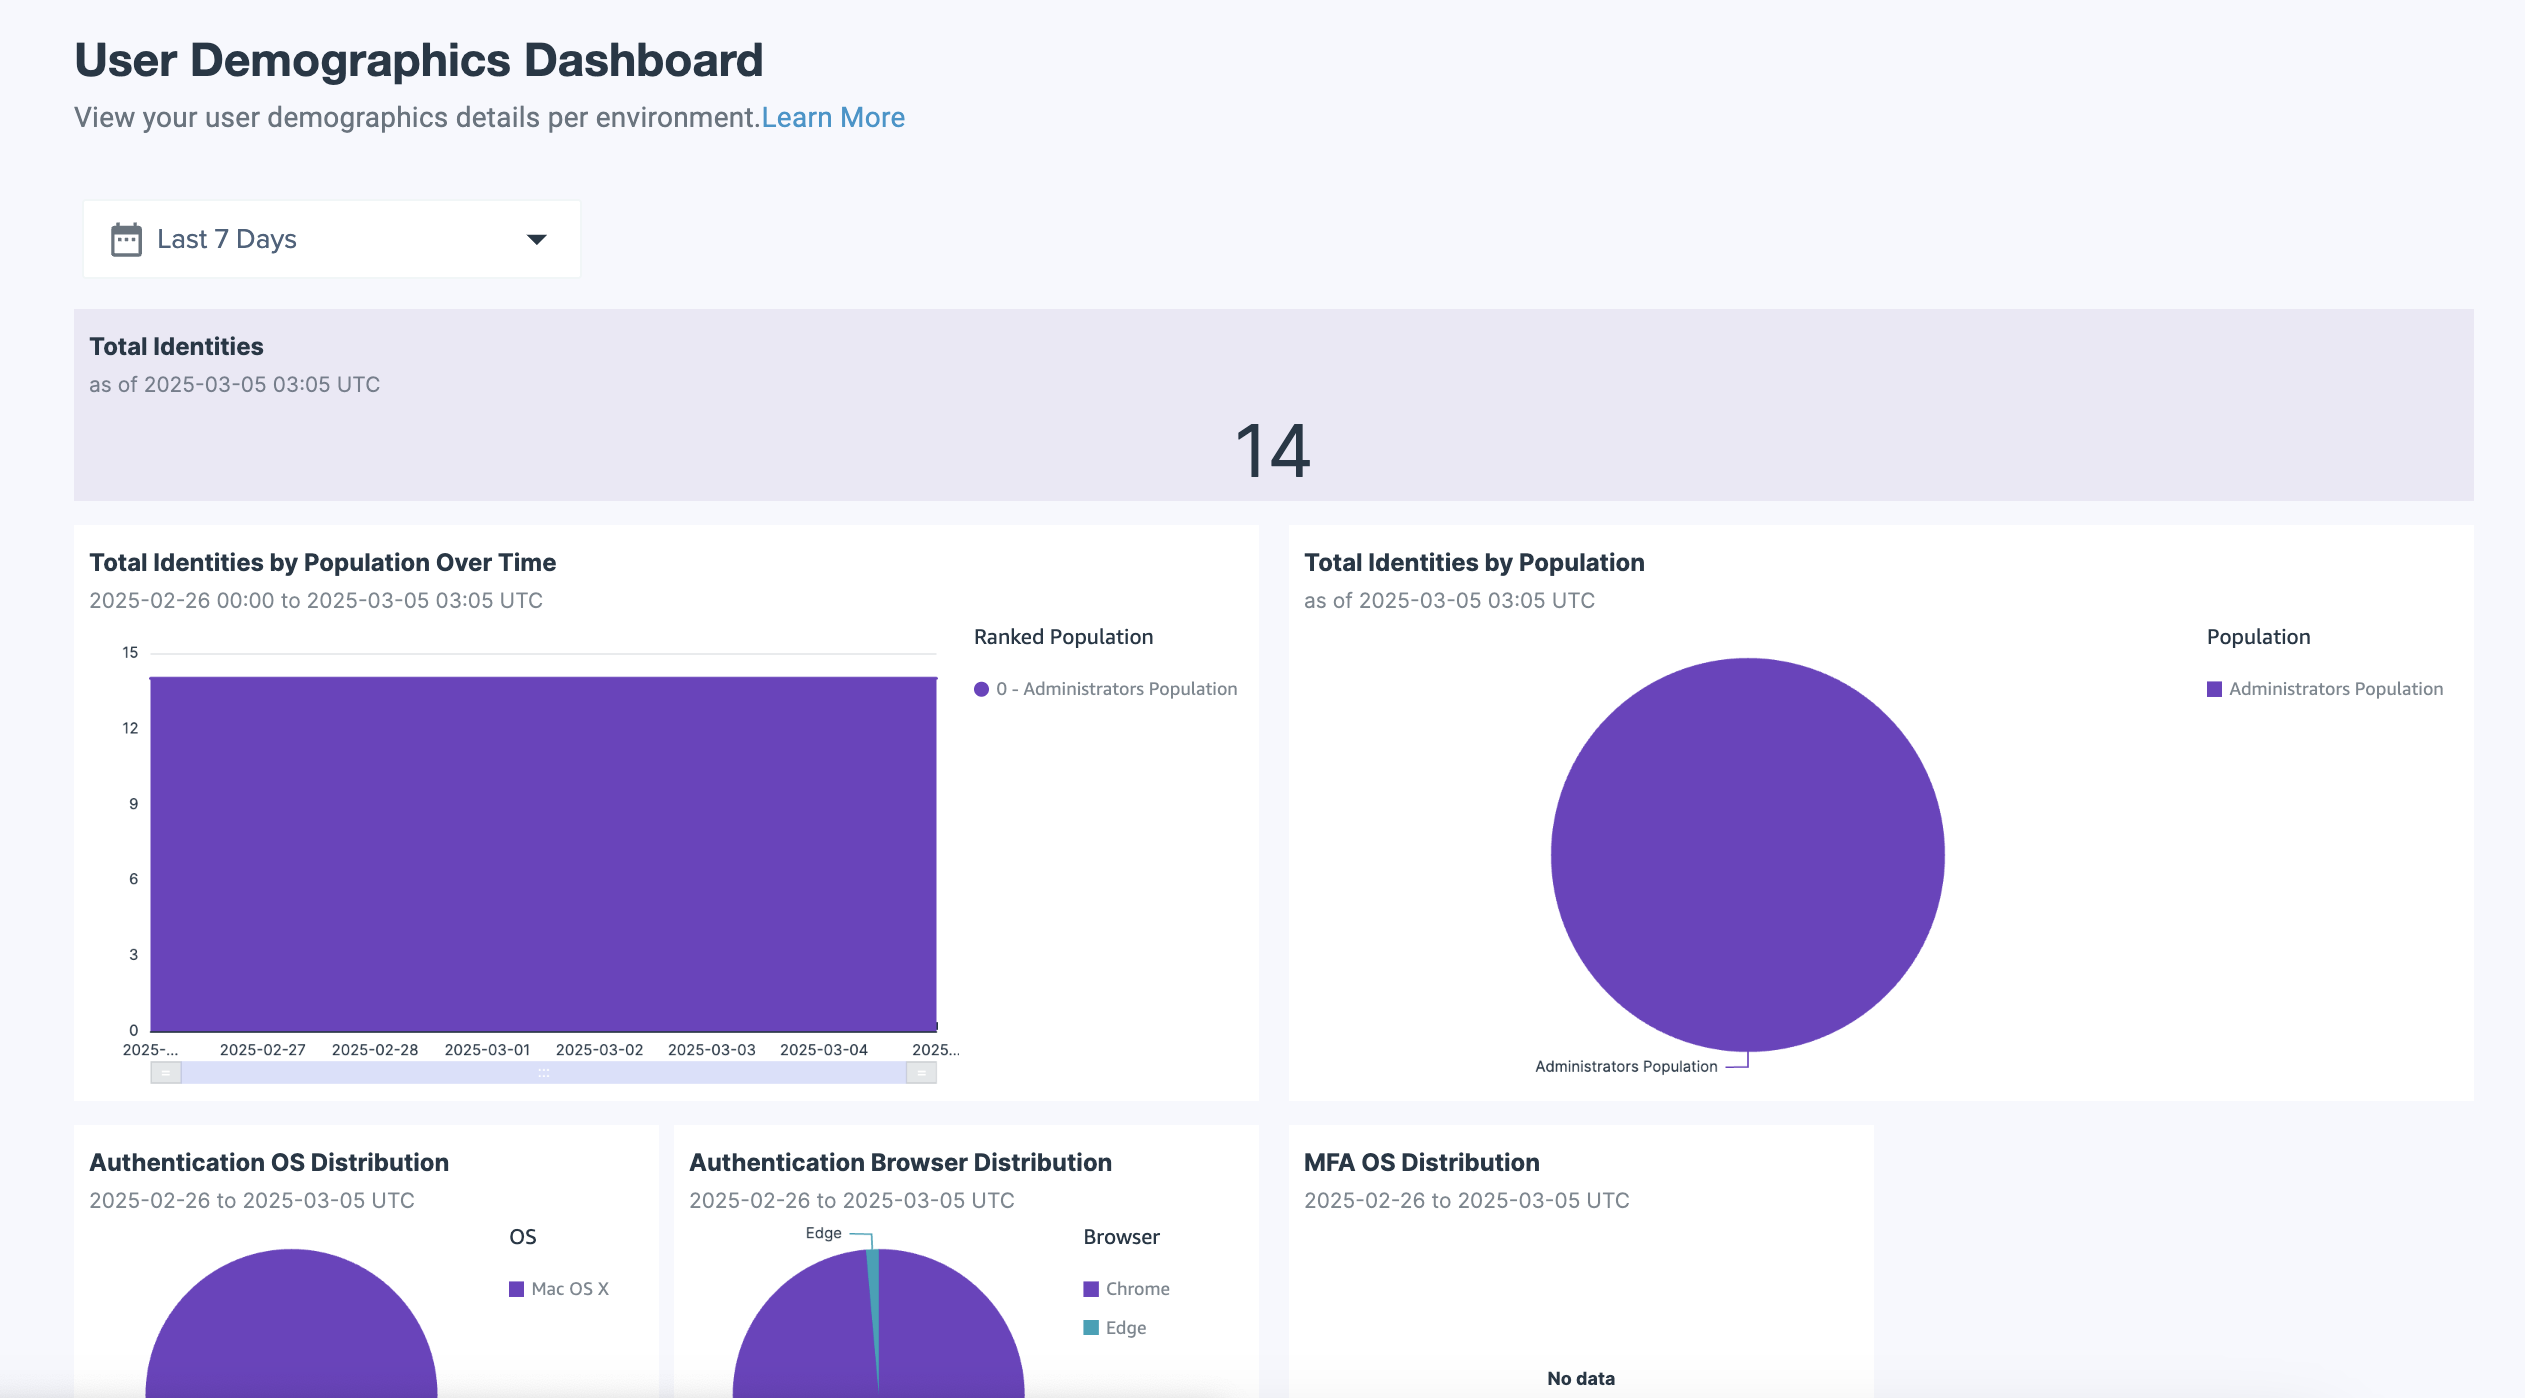
Total Identities
Displays the total count of identities in the environment at the current date and time.
|
The Total Identities and Total Identities by Population charts are not affected by the date filter. They always display current data, regardless of the selected date range. |
Total Identities by Population Over Time
Displays the daily changes in the total count of identities, broken down by population groups over time. This chart shows how the identity count changes, indicating trends in different populations.
The top 10 populations by number display in the chart distribution. All other populations are cumulatively counted under Other.
Total Identities by Population
Displays the current distribution of identities by population.
Authentication OS Distribution
Displays the distribution of authentication attempts by the operating system for the selected time period.
|
Updates for Authenticate OS Distribution and Authenticate Browser Distribution happen once a day at midnight, UTC. Depending on your time zone, these updates might not be visible for you at the end of the day. |
Authentication Browser Distribution
Displays the distribution of authentication attempts by browser distribution for the selected time period.
|
Authentication OS Distribution and Authentication Browser Distribution charts only display data for single sign-on (SSO) and do not include multi-factor authentication (MFA). The MFA dashboard has the mobile Authentication OS distribution chart. |
DaVinci OS Distribution
Displays the distribution of DaVinci usage by operating system for the selected time period.
DaVinci Browser Distribution
Displays the distribution of DaVinci usage by browser for the selected time period.
Protect OS Distribution
Displays the distribution of successful Protect risk evaluations by Operating System for the selected time period.
Protect Browser Distribution
Displays the distribution of successful Protect risk evaluations by browser distribution for the selected time period.
MFA OS Distribution
Displays the distribution of MFA attempts by operating system for the selected time period.